|
Service Ticket Report |
Scroll |

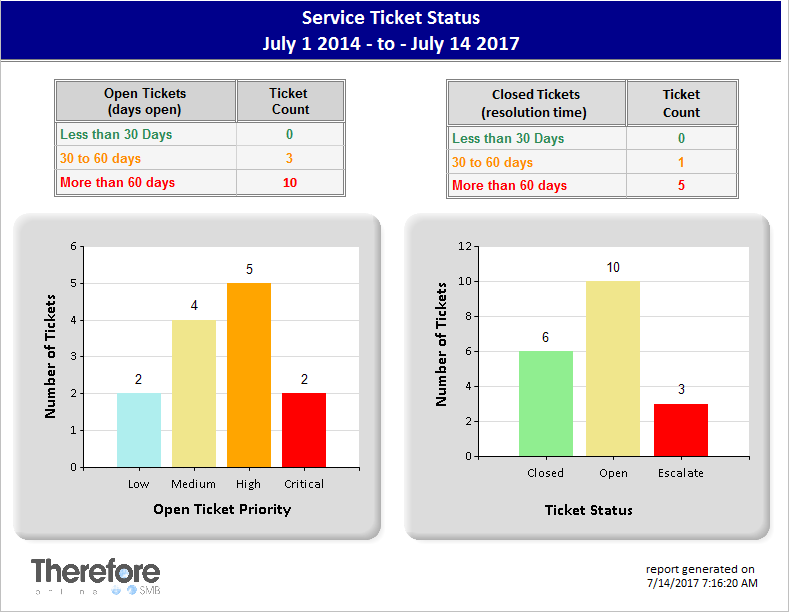
Sample 'Service Ticket Report'
This report displays the status of tickets in the Service Ticket category.
Open Tickets (days open)
This chart displays the number of service tickets that have been open for certain periods of time (less than 30 days, 30 to 60 days, and more than 60 days).
This is calculated based on the date the report was created and the Date Assigned field in the category.
Open Ticket Priority
This chart displays the priority levels of open tickets. This comes from the Ticket Priority field in the category. The default priority levels are:
•Critical
•High
•Medium
•Low
Closed Tickets (resolution time)
This chart displays the time it took to close service tickets (less than 30 days, 30 to 60 days, and more than 60 days).
This is calculated based on the Date Assigned and Date Closed fields in the category.
Ticket Status
This chart displays the status of service tickets in the category. This comes from the Ticket Status field in the category. The default statuses are:
•New
•Open
•Escalate
•Closed
